If you read Larry Summers in the Financial Times, you know that recent data confirm falling prices in the euro zone. Summers argues that the deflation indicates global stagnation, though we find disagreement on the appropriate interpretation. For some it is no more than the transitory effect of falling petroleum prices.
The focus on petroleum prices indicates the analytical limitations of composite price indices for understanding what is unfolding in the euro zone. A professed function of these indices is to serve as an indicator for central bank inflation targeting. The relationship is well-known. Central banks take a rise in the composite price index above some arbitrary guideline to indicate the need to increase interest rates. The increase in the central bank rate allegedly curtails credit growth and dampens inflationary pressures.
Even should one believe the interest rate to inflation causality, a composite price index is not the appropriate indicator for central bank action be it measured for consumers, producers or GDP as a whole. Composite indices all mislead more than they inform.
The misleading effect of composite prince indices is especially serious for the euro zone. First and most obviously, euro zone price indices conceal variations in inflationary pressures across member countries.
The chart below shows this variation by year for fifteen euro zone countries, 2000-2014. In 9 of the 15 years inflation rates across countries were less than their variation, casting into doubt the justification for a common policy. For example, in 2014 the lowest rate was -2.9% (Estonia) and the highest 3.6% (Ireland).
Average rate of change of the GDP price deflator across 15 euro zone countries & the relative variation*, 2000-2014 (15 countries)
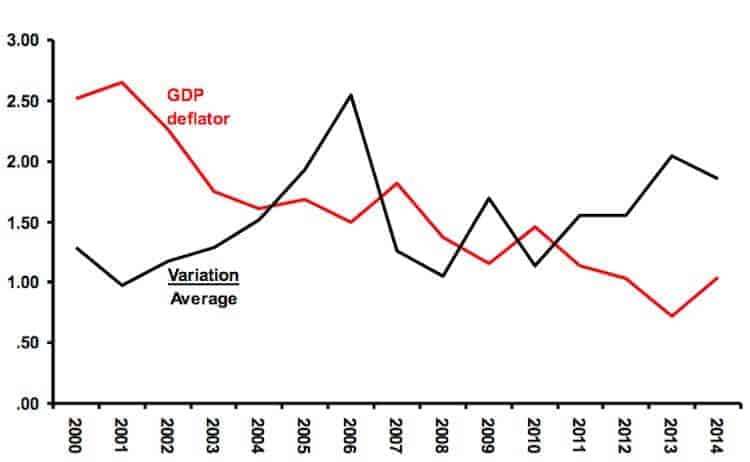
*Relative variation measured by the coefficient of variation, standard deviation divided by the average. Source: www.oecd.org/statistics
Even were the across country variation quite small, a composite price index delivers misleading information. The serious limitations result from composite indices including prices determined in at least three quite different ways, in external markets (imports), by administrative or contractual regulation (“sticky” domestic), and in domestic spot markets (“flexible” domestic).
Among imported commodities petroleum is the most important for Europe. In an open economy with flexible exchange rates, as is the case for the euro zone, no domestic policy instrument has a substantial impact on import prices.
The second category, sticky domestic prices, includes those under public sector regulation (e.g. utility rates) and private sector contracts (e.g. wage bargains and futures contracts). These prices respond sluggishly to short-term economic conditions if at all.
For both imports and sticky domestic prices attempts to constrain price increases results in quantity adjustment – a fall in amounts purchased by domestic buyers.
Commodity and service prices set in the very short term, “spot prices”, most closely to the neoclassical economics fantasy world of “perfect competition”. The most important of these prices is wages of unorganized workers.
It should be obvious what happens when the European Central Bank, the US Federal Reserve or any other central bank adjusts interest rates to constrain price increases. Almost the entire burden of adjustment falls on the flexible domestic prices, especially wages of unorganized, low-wage workers.
In the euro zone price indices may now convey consistently wrong information for an additional reason. Five years of stagnation appear to have broken the link between inflation and economic expansion. This takes us back to Larry Summers’ “global stagnation”.
Stag[de]flation In The Euro Zone
Since the end of World War II in the advanced countries the cycle of expansion and recession typically took the pattern of a positive relationship among output, employment and inflationary pressures. When economic growth brought the economy close to full capacity, the tightness of the labor generated rising money wages, which in turn put upward pressure on prices.
In the countries with large economies, e.g. United States, Japan, United Kingdom, Germany and France, the growth-capacity-inflation link was primarily domestic until the share of trade in GDP began to increase sharply in the 1990s. The only notable exception to this pattern occurred in the second half of the 1970s when sharply rising oil prices had the dual effect of undermining growth rates and increasing composite price measures. This combination of recession and “inflation” prompted the term “stagflation”.
The recently released statistics on price changes and growth in the euro zone suggest that the term be qualified to refer to two different manifestations of the malady. In the 1970s the advanced market economics suffered from inflation and unemployment, “stag[in]flation”; now, the euro zone – and the global economy according to Summers – suffer from recession and falling prices, “stag[de]flation”.
The chart below shows the unfolding of this market malady. The percentage rate of change of non-energy prices across 19 euro zone countries is measured on the vertical axis and the growth rate of GDP on the horizontal (both as annual equivalent rates) for the 14 quarters from the beginning of 2012. I take the non-energy index to be an indicator of domestic prices, both flexible and “sticky”.
Inspection of the chart reveals an unexpected relationship – a rising growth rate is associated with lower rates of price change. This relationship over the last four-and-one-half years might prompt supporters of fiscal austerity to think that the euro economy has reached the promised land of growth and low inflation.
Quite the contrary is the case. The chart shows that the persistently low growth rates of GDP have inculcated a regime of economic stagnation. Over the 14 quarters every annualized growth rate was 1.5% or lower, far too low to sustain employment levels. Indicators strongly suggest that the rate for 2015Q3 will come in below that for the second quarter, perhaps below one percent (German exports fell by over 5% in August).
With output stagnating, how can we explain the increases in non-energy prices? The most obvious cause is so-called Quantitative Easing, which fuels domestic and international commodity speculation while doing nothing to simulate output (Summers is especially clear on the latter).
Other processes reinforce the QE effect: 1) sub-optimal level of capacity utilization that that raises unit production costs; 2) low investment that accentuates productivity decreases; and 3) imported inflation working through inputs to output prices.
Interaction of changes in non-energy prices and GDP growth rate, 2012Q1-2015Q2
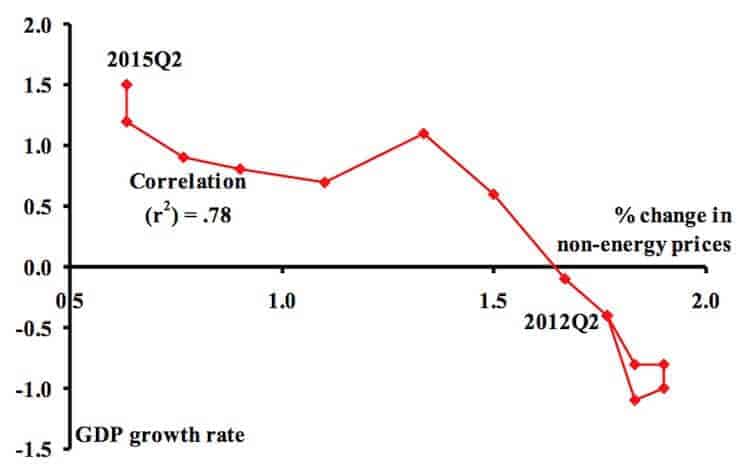
Source: Eurostat
No Way Out?
Stimulating aggregate demand offers the only effective way to exit stag[de]flation. In contrast to fiscal austerity that has inverted the price-output relationship, fiscal expansion would initially combine rising GDP with stable prices as output growth raised productivity and stopped QE.
The euro zone countries, led very much from the front by the German government have “structurally-reformed” themselves into the cul de sac of institutionalized stagnation. Labor market “reforms”, fiscal cuts and reduction in the progressivity of tax structures all weaken automatic stabilizers and undermine the countercyclical mechanisms that prevent an integrated economic system from partially healing itself out of recession.
The way out is obvious to those not blinkered by the austerity ideology. But the blinkered austerity dwellers, the fiscal troglodytes, hold government throughout the euro zone. Indeed, the Trogs successfully saw off in Greece the only serious challenge to their stag[de]flation strategy.
For the foreseeable further there is no way out. It is that simple.