The global distribution of incomes has been changing without us noticing very much.
The period of ‘high globalisation’, which ran from the end of Communism in the late 1980s to what became known as the Global Financial Crisis in 2008, was perhaps best described by the so-called elephant chart (the blue curve in the figure below), produced by Christoph Lakner and myself. It showed a very high increase in incomes over these two decades around the middle of the global distribution, point A (call it ‘the China effect’), very modest or close to zero growth around the 80th percentile of the distribution, point B (where the lower middle classes of rich countries are), and a sharp increase among the global top 1 per cent, point C.
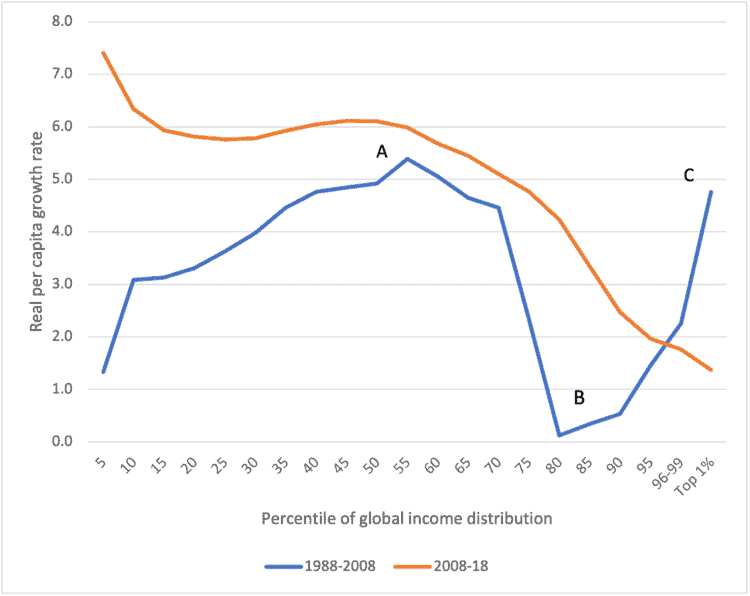
The popularity of the ‘elephant chart’ was due to its empirical confirmation of what many thought. Rapid increase in Asian incomes coincided with—and perhaps was causally related to—the decline of the western middle classes, as well as the rise of the global 1 per cent.
This pattern of income growth did not however continue unchanged during the decade 2008-18, ending just before the pandemic. The new data show both continuity and change (the orange graph). The continuity is represented by high, even accelerated growth of real incomes in Asia; the change is represented by a significant slowdown in growth among the global top of the distribution.
Western slowdown
To understand both, we have to go back to the effects of the crisis of 2008. In reality it was a northern-Atlantic crisis. While the growth of rich countries in Europe and north America decelerated or even turned negative (for members of the Organisation for Economic Co-operation and Development as a whole it was negative in both 2008 and 2009), growth in Asia, and especially in China, was practically unaffected.
The western slowdown, due to the financial nature of the crisis, hurt the richest income groups. What happened in the United States is the most instructive, as well as the most important, because US citizens account for almost half of the global top 1 per cent.
According to US income surveys (further harmonised by the Luxemburg Income Study), the top 5 per cent of the US population lost about 10 per cent in real terms between 2008 and 2010, with the richest 1 per cent seeing their incomes go down by almost a fifth. In the next few years they recovered but they reached the 2007 level only in 2015. For the US richest, and by extension for the globally rich, almost a full decade was ‘lost’. This explains why the trunk of the ‘elephant’ (representing the income growth of the globally rich) was lowered compared with the period of high globalisation.
Incidentally, and going beyond the time boundary of our analysis (2008-18), the most recent years show a continuation of this trend for the US. The very large support programme in the Coronavirus Aid, Relief and Economic Security (CARES) Act enacted in 2020 resulted in a substantial decrease in post-transfers and post-tax income inequality. The Gini coefficient—which ranges from a complete-equality zero to an infinite-inequality 100—for the US decreased by more than one point, the largest fall in half a century. One of the ironies is that this large decline occurred during the last year of the Donald Trump presidency.
Continued growth in Asia
Going back to what happened between 2008 and 2018, we note the continuation of fast Chinese and Indian growth. In terms of gross domestic product per capita, China grew at 7.5 per cent per year, India 6 per cent. This growth shows also in their household surveys. For example, for both urban and rural China the surveys give an average per capita annual growth of about 10 per cent, for urban India 8 per cent and for rural India just below 5 per cent.
This continued growth in Asia fundamentally transformed global income distribution in two ways. It increased the size of the global ‘median’ class and it produced a reshuffling of global income positions. The former means that the ‘thickness’ of the middle part of the global distribution is greater now. The latter means that as Asian incomes grew people from Asia displaced in the global ranking many people from the lower parts of rich countries’ distributions.
This effect may be best illustrated by Italy, which did not grow in over two decades. The lowest decile of Italians were in 1988 at the 73rd global percentile; 20 years later, as Asian incomes grew and as large groups from urban China achieved higher incomes than the Italians, these lower-income Italians slid down the global pecking order to the 56th global percentile. Similar but less dramatic downward movement affected the bottom third of the German and American populations.
Such downward movement is ‘positional’: it need not imply a decline in real incomes and in many cases real incomes did not go down. What it does imply however is slower income growth among rich countries’ deciles ‘within the range’ of rising Chinese incomes.
New global dynamic
The current reshuffling represents probably the largest since the industrial revolution. It introduces an entirely new global dynamic, because during the last two centuries people from western countries and Japan were almost fully ‘in control’ of the global top quintile. (Of course, many people from other counties were in the top quintile too but they were not there in millions.) This ‘control’ has already weakened with the entry of China into that circle and, if the differentials in the growth rates between ‘the emerging’ Asia and the west continue, it will weaken even further.
Reshuffling in positions by itself does not imply a reduction in global inequality. Since the beginning of the current globalisation era, inequality has been reduced almost entirely on account of rapid Chinese growth. But now as China is an upper-middle-income country, mathematically its further growth no longer reduces global inequality. Indeed, it could begin to add to global inequality, as the distance in incomes between China and the very populous African countries grows.
Thus while in the next stage of globalisation we may expect further strengthening of the global ‘median’ or middle class, what happens to global inequality will crucially depend on the growth of India and of the populous African countries: Nigeria, Egypt, Ethiopia, Tanzania, Congo. Our attention should be directed towards Africa.
This is a joint publication by Social Europe and IPS-Journal