In the years before the financial crisis of 2008, there was a significant reduction in overall EU wage inequality, driven by economic convergence between rich and poor Member States. The 2008 crisis reversed the trend, expanding pre-existing wage differentials between countries. The impact of the crisis on wage inequalities within countries has also varied greatly across the EU.
It is still far-fetched to speak about a single European labour market but the very significant extent of economic integration in recent years makes a European perspective on the wage distribution not only relevant, but necessary in order to evaluate the wider consequences of the single market. And yet, there is a surprising lack of studies from a truly EU perspective on this issue. In the report “Recent developments in the distribution of wages from an EU perspective”, my colleague and I present the findings of a study recently carried out by Eurofound trying to cover this gap and look at wages from a pan-European perspective.
Visualizing the distribution of wages from an EU perspective
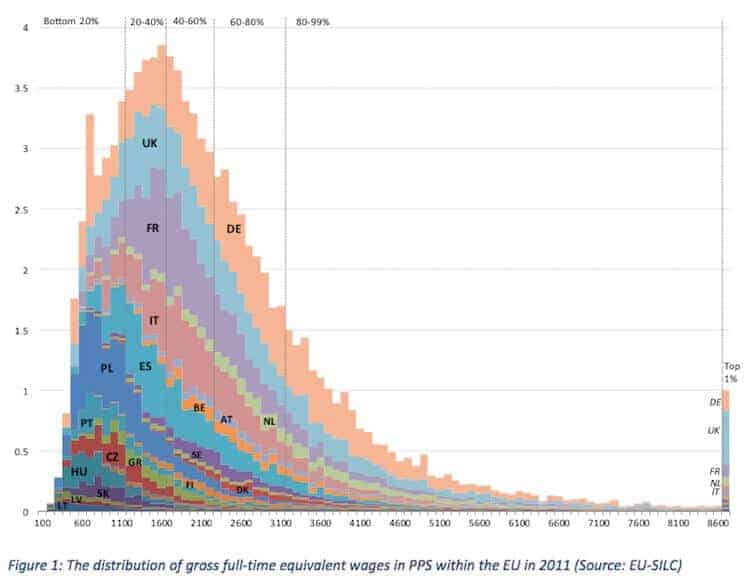
Because the EU labour market is still strongly divided by national boundaries, any analysis of wages from an EU perspective has to simultaneously take into account two axes of the distribution: the between-countries and the within-country. This is visually represented by figure 1.
Progressive Thinking on the Big Issues of Our Time
Read by policymakers, academics and journalists in 100+ countries.
This figure represents, on the horizontal axis, intervals of monthly full-time equivalent wages in Purchasing-Power Parity (PPP) Euros; in the vertical axis, the percentage of European employees reporting wages in each interval. So, for instance, we can see that nearly 4% of European employees earn between 1500 and 1600 euros per month, on a full-time equivalent PPP basis. But, critically important, each bar is broken down by country: this way, we can see that although countries have distinct positions in the overall EU wage structure (for instance, Eastern Member States dominate the bottom 20% while the UK is disproportionately present in the top 1%), there is a significant amount of overlap (for instance, the UK and Germany have a significant presence in the bottom 20% as well, despite their dominant presence at high wage levels). Again, it is important to emphasize that the comparison is carried out in PPP terms: otherwise, there would be much less overlap.
The distribution of wages in Europe before and after the crisis
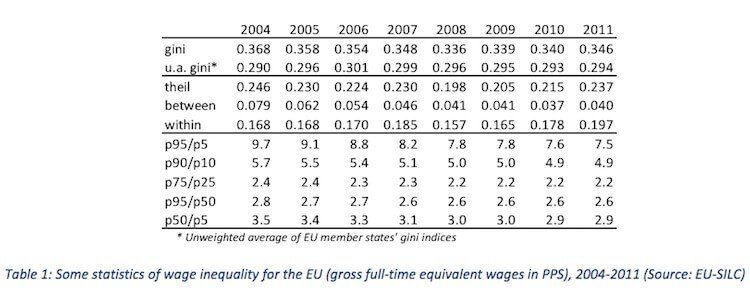
Table 1 below shows a number of inequality statistics for the EU wage distribution, and their change over the period 2004-2011. Two points stand out:
The Gini index for EU full-time equivalent EU wages in PPP is 0.346 (in 2011). This value is considerably higher than the comparable measure for most EU countries but lower than the value of the three most unequal member states (the UK, Portugal and Latvia). It is also lower than the comparable measure for the US, the most comparable international entity (which, according to a recent OECD estimate, would be around 0.4 for full-time employees).
Between 2004 and 2008, EU-level wage inequality decreased. After 2008, it increased. The pre-2008 decrease was entirely the result of a reduction of between-countries wage differentials (within-country inequality remained broadly stable). After 2008, there was no further reduction of between-countries differentials while within-country inequality tended to increase in overall terms.
The evolution of wage differentials between countries
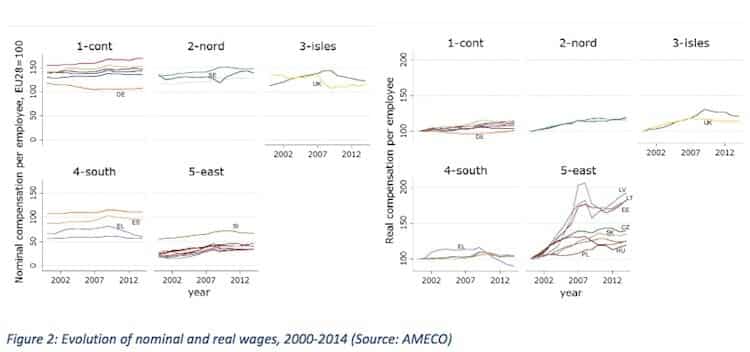
Figure 2 below provides a more detailed look at the evolution of between-countries wage differentials, drawing from AMECO data. The 2004-2008 convergence in national wage levels was mostly driven by a rapid process of catch-up by Eastern Member States and a stagnation (even decrease) of wages in the two biggest countries (UK and Germany). Southern European average wage levels only converged in nominal terms before 2008, remaining stagnant in real terms. The reversal of convergence after 2008 was driven by a large drop in wage levels in Southern Europe (in nominal and real terms), while German wages started to grow timidly.
The recent evolution of wage inequalities within EU countries
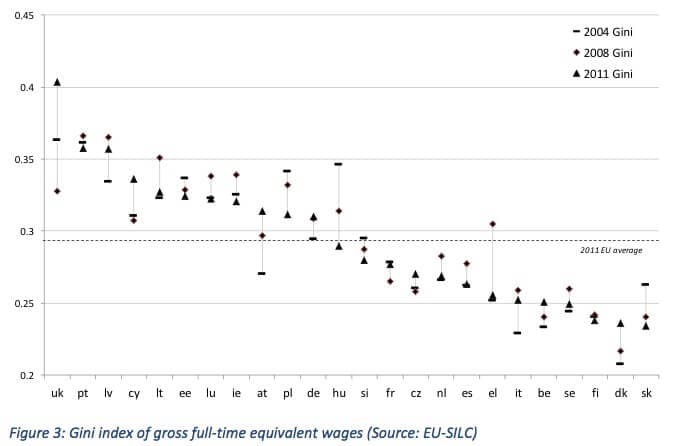
Finally, figure 3 shows the evolution of the Gini index of full-time equivalent wages for each Member State over the period 2004-2011. There is a wide diversity of developments, but perhaps the most common pattern is a cyclical one, with wage inequality increasing until 2008 and decreasing afterwards. The biggest exception is the UK, where wage inequality behaved in the opposite way and so strongly that it largely determined the within component of overall EU inequality. On the other hand, wage inequality consistently decreased throughout the whole period in many Eastern European member states, while it consistently increased in Austria, Belgium and Denmark.
However, the impact of the crisis on within-country wage inequalities must be put in the wider context of developments in income inequalities. In particular, in some Southern European countries the reduction of wage inequalities after the crisis was the result of a massive destruction of employment, which shifted some of the existing inequality outside of the labour market, increasing it significantly in overall terms.
Enrique Fernández-Macías is a Researcher working in the Joint Research Centre (JRC) of the European Commission in Sevilla. He holds a PhD in Economic Sociology by the University of Salamanca, and his main research interests are job quality, technology & occupational change and the division of labour. Before joining the JRC, he worked in the University of Salamanca and Eurofound (Dublin).
New publications by our partners Harvard University Press
Membership Ad Preview
Help Keep Social Europe Free for Everyone
We believe quality ideas should be accessible to all — no paywalls, no barriers.
Your support keeps Social Europe free and independent, funding the thought leadership, opinion, and analysis that sparks real change.
★
Social Europe Supporter — €4.75/month
Help sustain free, independent publishing for our global community.
★ ★
Social Europe Advocate — €9.50/month
Go further: fuel more ideas and more reach.
★ ★ ★
Social Europe Champion — €19/month
Make the biggest impact — help us grow, innovate, and amplify change.