Successive crises have shaken the European Union since 2020. On top of the pandemic, the full-scale invasion of Ukraine in 2022 led to sanctions against Russia, which triggered in turn an energy crisis, contributing to inflation. These economic repercussions, reinforced by the associated distributional conflicts in the context also of the climate crisis, strengthened populist movements in several EU member states.
Against the backdrop of this ‘polycrisis’, the actual social development of the EU looks however surprisingly good, albeit quite heterogenous. This is evident from the distribution of income among and within member states and the trend in EU-wide inequality.
Uneven development
Since the ill-managed sovereign-debt panic of 2010 (the ‘eurocrisis’), the two EU peripheries have developed quite differently (Figure 1). The southern periphery suffered from imposed austerity and subsequent weak growth. The poorer eastern periphery of post-communist countries that had joined the union after 2004 performed surprisingly well.
In central and eastern Europe (CEE), per capita gross domestic productincreased in 2012-22 from under 40 per cent of the EU average to over half. In the south (including Italy) meanwhile, it declined by almost ten percentage points from over 90 per cent of the EU mean.
Figure 1: gross domestic product per person (EU average = 100)

In the recent crisis, with a more expansionary fiscal policy embodied in the NextGenerationEU recovery plan, both peripheries have been growing faster than the rich EU centre. In 2022, GDP discounted for inflation rose by 4.8 per cent in CEE, as against 2.5 per cent in the northwest. This was however mainly due to the sustained high growth of Bulgaria and Romania, while the Baltics, particularly Estonia, lost ground.
In the same year, in the south real GDP grew by even more, 5.0 per cent. While CEE has suffered from high inflation in the wake of anti-Russian sanctions, the south, whose tourism-heavy economy was badly hit by the pandemic, was able to recover, possibly due also to its better position for producing renewable energy. Indeed Greece secured a growth rate of 7.8 per cent in 2022, against an average of 0.4 per cent over the previous ten years.
Inequality and poverty
Last autumn, Eurostat published the results of the latest wave of its household Survey of Income and Living Conditions, from which can be calculated poverty rates and inequality within member states. One measure is the quintile ratio (also called S80/S20), which divides the aggregate income of the richest fifth of the population by that accruing to the poorest 20 per cent.
The new data for 2022, the year of Russia’s invasion, show on average for all 27 member states a decline in inequality (Figure 2), following an increase in 2021. Between 2020 and 2022 the mean EU quintile ratio fell from 4.89 to 4.74. Again that conceals divergence: in 2022, S80/S20 ranged from 7.1 in Bulgaria to 3.1 in Slovakia. And while some member states, such as Germany, Romania, Luxemburg and Bulgaria, have reduced inequality substantially since 2020, others, above all Estonia and Sweden, have seen increases.
Figure 2: change of the S80/S20 income ratio, by EU member state, between 2020 and 2022 (%)

Generally, poverty rates showed a similar trend with, on average, a slight decline between 2020 and 2022. In most member states, poverty declined (or increased) together with inequality. (Poverty did however increase strongly in the Netherlands and slightly in Italy while inequality declined; in Sweden and Malta, conversely, poverty fell in spite of rising inequality.)
The causes of this national divergence are hard to identify. In Germany, the government spent large amounts to cushion the effects of the crisis. Romania and Bulgaria benefited from their strong general growth. And the conflict with Russia may particularly have harmed Sweden, Finland and the Baltic countries.
Falling EU-wide inequality
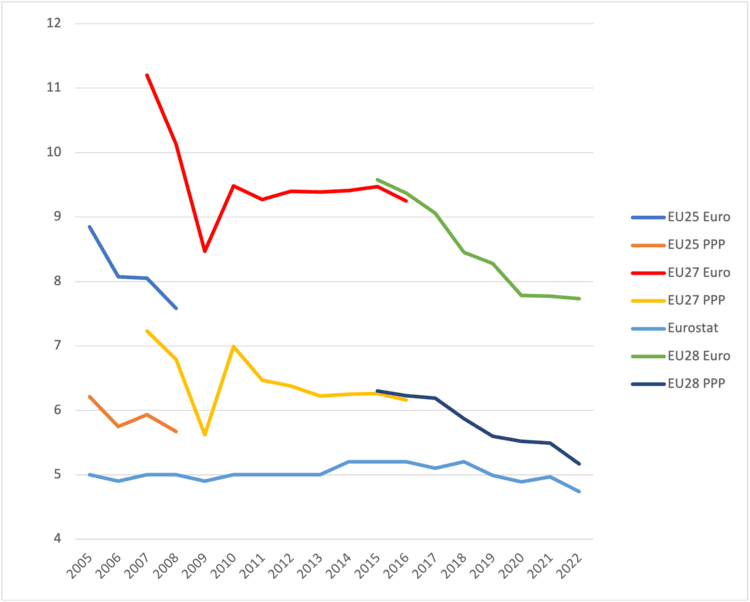
To assess the extent of inequality across the EU, the two dimensions of the distribution of income—among and within countries—have to be combined. An S80/S20 calculation can be made for the incomes of the richest and poorest quintiles of the total EU population at purchasing-power parities, which adjust for price differentials among member states (in poorer countries prices tend to be lower). Using the recently available data from Eurostat, EU-wide inequality declined further on this measure in 2022, to 7.73 (unadjsted) and 5.17 (at PPP) (Figure 3). This is hardly surprising, given both components of the distribution, among and within countries, became less unequal in 2022.
Figure 3: EU-wide inequality 2005-22 (S80/S20 ratios)

The EU-wide poverty rate can be defined as the share of the population with an income below 60 per cent of the median across the union. Again this is lower when incomes are measured at PPP: from 2021 to 2022, it declined from 24 to 22 per cent (unadjusted) and from 19.4 to 18.35 per cent (at PPP).
Overall, the new Eurostat data confirm the estimations of our previous study. They show that, up to 2022, Europe weathered the storm of the polycrisis quite well. The EU and many member states used unconventional—in particular looser fiscal—policies to cushion its effects. A return to previous austerity would however bode less well for social cohesion.
