As the pandemic turns endemic and most restrictions—let alone lockdowns—fade, we can reflect on its impact on the distribution of income in Europe, among and within countries. Eurostat has now published the relevant 2021 data, unavailable at the time of our last analysis.
The pandemic hit some countries harder than others (figure 1). Southern Europe, which depends much more on tourism, suffered most. Between the years 2019 and 2020, average gross domestic product per capita decreased in the Mediterranean region by 8.5 per cent, compared with a decline of 2.2 per cent in central and eastern Europe (CEE) and 2.7 per cent for the rich northwest of the European Union.
In 2021, most EU member states recovered quickly, but unevenly. Between 2019 and 2021 (inclusive), GDP per capita increased on average among them by 3.6 per cent, but it still declined in Spain by 3.7 per cent. Southern Europe generally declined by 1.3 per cent, while the poorer CEE managed to grow by 8.4 per cent (the Baltic states were the star performers with rates above 12 per cent) and the rich northwest achieved a more modest growth rate of 4.4 per cent. If we look at the EU as a whole, the variance of country per capita incomes, which had decreased since 2014 (then 0.71), increased from 0.65 to 0.69 during the pandemic, indicating renewed divergence.
Figure 1: per capita GDP growth of major EU country groups, 2013-21
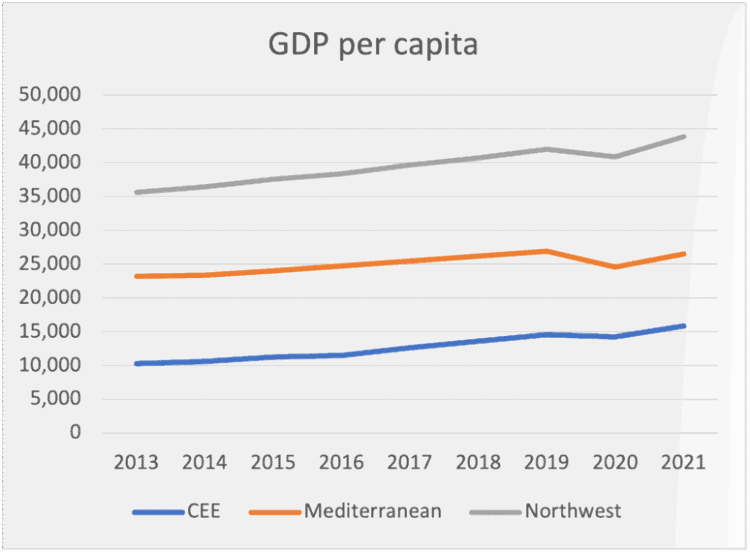
Figure 1 also shows the different long-run fate of the EU’s two poorer peripheries. While the CEE region continued to catch up with the rich core, growing by 54 per cent since 2013, southern Europe—although on average richer by somewhat more than €10,000 per person per year than the CEE group—managed only 14.3 per cent, compared with the core’s 23 per cent, thus not achieving convergence.
Most incomes protected
Within individual countries, the major impact of lockdowns was sectoral, harming certain industries such as tourism, restaurants and hotels. In these industries rich owners suffered as well as poorer employees. But states answered with huge spending programmes, including furlough, which prevented a strong rise in unemployment. Thus, most incomes were protected to a considerable extent.
The Gini coefficient is a measure of inequality, ranging from 0 (perfect equality) to 100 (absolute inequality). Averaging trends across states, the Gini coefficient of incomes before taxes and social transfers increased (from 50.2 in 2019 to 52.2 in 2021) but the (always much lower) Gini of disposable income even decreased slightly, from 30.2 in 2019 to 30.1 in 2021, indicating declining inequality. The same result can be seen when we use the quintile ratio (S80/S20) of the incomes of the richest to the poorest fifths of the population. Its average value, measured by Eurostat, also declined slightly, from 4.99 to 4.97 (figure 2).
This relatively rosy picture overall hides however some discrepant national performances. Again, southern Europe had the worst outcomes, with strongly rising quintile ratios in Malta (+0.85), Greece (+0.68), Portugal (+0.5) and Spain (+0.25)—these four countries showing the highest jumps in inequality. Constraints on social spending, due to already high debt in the context of the EU fiscal rules, might be one cause. Other countries saw inequality declining by similar amounts: in Luxemburg, the EU’s richest country, the quintile ratio decreased by 0.75 and, surprisingly, in Bulgaria (the poorest and most unequal member state) it fell by 0.65.
Continued catch-up
Combining between- and within-country inequality, we can determine the income distribution across all households of the EU, using EU-SILC (the Survey of Income and Living Conditions). This provides data on disposable income for approximately 130,000 households. These incomes have however different purchasing power in their respective countries. Therefore inequality should be measured in two ways: using exchange rates to standardise against the euro and applying purchasing power standards (PPS) to adjust for the differential cost of a basket of goods.
To reduce the numbers to be analysed we apply the quintile method, comparing the average incomes of each of the 135 quintiles of the EU population (27 countries timS20es 5 quintiles). Assembling the appropriate national quintiles we construct the EU-quintiles, with about 88 million people each, and calculate the quintile ratio by dividing the income of the richest EU quintile by the income of the poorest (figure 2).
Figure 2: EU-wide inequality (S80/S20 ratio) 2005-21

EU-wide inequality has declined since 2015, after a prolonged phase of stagnation. The major cause has been the strong growth of the poorer CEE countries—whose poorer quintiles make up the bulk of the poorest EU quintile—while within-country inequality has hardly changed. As this welcome catch-up growth continued during the pandemic the overall trend continued too, albeit at a slower rate.
The terrible performance of the Mediterranean periphery hardly affects this development, as they belong to the middle-income group of member states. Given that, it seems most appropriate that the EU is supporting the heavily affected countries through the NextGenerationEU recovery programme. One has also however to consider that the newest crisis hitting Europe—the war between Russia and Ukraine—is likely to affect the eastern periphery more than the south, possibly changing their relative fates.