Inequality within member states has become a much debated and researched issue over the last decade (see OECD here and here). Reducing the inequality between member states (i.e. convergence) is a target the European Union (EU) has set itself in its treaties and monitors through its cohesion reports.
But what about the EU as a whole? If we consider the EU as a single economy, society and polity in the making, how large is the inequality in this Union and how did it change over time? There is far less analysis looking into EU-wide inequality. But some studies exist such as a recent Eurofound study on income inequalities in Europe, which provides an overview over other studies as well.
Measuring EU-wide inequality
To measure Europe-wide inequality can be cumbersome as one must take into account the distribution of income between and within member states. The most exhaustive approach takes all 28 national (or EU-SILC) household surveys and orders the households according to their income. This way one can calculate the EU-wide Gini, which ranges from zero (complete equality) to one or hundred (one person gets all the income) or other indicators of inequality. Current studies give values of about 0.336 for the EU-wide Gini of disposable income in 2014 (USA: 0.39), down from 0.355 in 2004. National Gini values are lower for most member states.
Since the Gini is hard to grasp, one can use another indicator, which is easier to understand: the S80/S20 ratio that gives the relation between the income of the richest and poorest quintile (20 percent) of the population. The European average of the national value of that ratio is about 5 (see figure 1, lowest line). That average hides substantial differences: While in Scandinavia and some Central European countries, the rich earn less than four times as much as the poor, in Romania, Bulgaria or the Baltic countries the value is above 6.
To calculate the EU-wide value, we built the approximate top and bottom quintiles of the whole EU (each comprising approximately 100 million people) out of the national quintiles. Then we compared the income levels at purchasing power standards (PPS) and at exchange rates. The resulting EU-wide S80/S20 inequality was 6.26 (PPS) and 9.47 (exchange rates) for the EU-27 (see figure 1).
Figure 1: Development of inequality in the EU
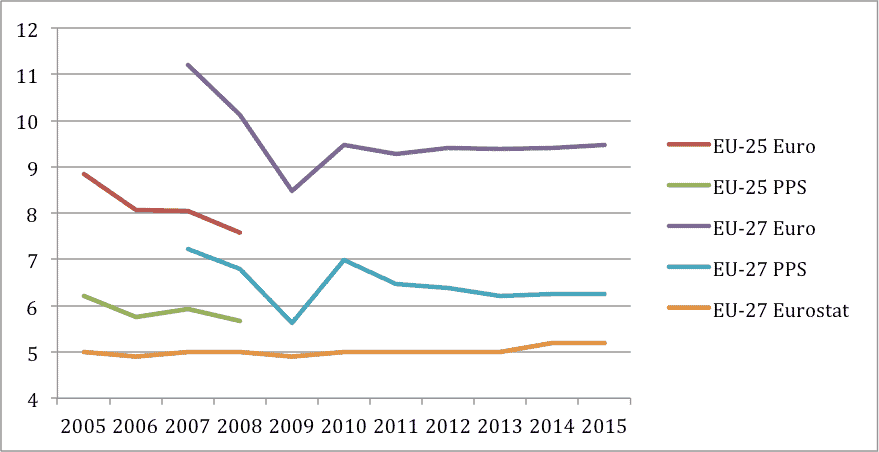
Source: Dauderstädt/Keltek 2017 (see here)
With the 2007 enlargement to Romania and Bulgaria, two large and very poor countries, that value has jumped. But after 2007, it has declined substantially from more than 11 to less than 9 (or from more than 7 to less than 6 at PPS). According to the UN Human Development report, the American value is 9.8. The crisis of 2009 reversed that European trend briefly. After 2010, there was little further progress.
It is difficult to assess how much within-country and between-country inequalities contribute to EU-wide inequality. The Gini and the S80/S20 ratio are not easily decomposable. Another indicator of inequality, the Theil index, is decomposable and studies suggest that within-country inequality is now responsible for about 80 percent of the EU-wide inequality. That share was higher ten years ago. Still, that value is based on PPS. At exchange rates, it might be much higher, perhaps 50 percent, given the disparities between the two values visible in figure 1.
In so far as inequality declined it was due to higher growth in the poorer member states rather than reduced inequality within member states. On average throughout the EU, that latter value has remained almost unchanged since 2005 (lowest curve in figure 1). Eurostat gives that average of national values, which neglects the huge income discrepancies between countries, as the EU value, thus misrepresenting the level and the trend of the EU’s inequality.
Does EU-wide inequality matter?
Political debates and conflicts focus primarily on inequality within member states. People worry about huge income discrepancies within their societies as they are accompanied by social problems and inequalities of life expectancy, health and many other things. Nonetheless, an increasing “Europeanization of income inequality” can be observed, according to some studies (e.g. Martin Heidenreich “Exploring Inequality in Europe”).
Indeed, the incomes of households in the EU tend to depend more and more on European factors. EU-enforced austerity policies affected growth, wages and social benefits in Greece, Spain, Portugal, Ireland and Cyprus. European liberalization, integration and regulation of markets determine the economic opportunities of people and companies. From a purely economic point of view, EU-wide income inequality in an integrated economy has noticeable effects. Poor EU citizens are likely to migrate to richer member states in order to improve their income chances. Large companies with the capacity to offshore part of their production processes will locate labor-intensive manufacturing to low-wage countries. Both processes affect the income and employment opportunities of low-skill workers in high-wage countries, thus contributing to higher inequality there.
Politically, the frustrating development of wages and employment in many richer member states contributed to the rise of nativist populism. Brexit voters have been motivated by the fear of too much immigration from poorer member states. Thus, the stagnation of inequality levels since 2011 (see figure 1) bodes ill for the future of Europe.
This is the latest in a series on inequality in Europe sponsored by SE, the Hans-Böckler-Stiftung and the Friedrich-Ebert-Stiftung
The author’s latest study is available here